

Johns Hopkins University has worked to compile data from the WHO, CDC, ECDC, NHC and DXY to help track the geographic spread of the novel Coronavirus known scientifically as COVID-19.
UPDATE- On March 10, 2020, Johns Hopkins announced that they would no longer report data below the state level for the United States. They announced ” In light of the increasing rate of cases being reported domestically in the U.S., and in order to retain timeliness and accuracy, we have switched from reporting at the county level to state level. “
Georgia STEM is attempting to maintain the map at the county level for Georgia. Of course, this will depend on how transparent the Georgia Department of Health and the CDC is willing to be when they report cases that have been confirmed. Currently, there are 287 confirmed cases in Georgia but they have not reported where 6 of the cases are located. 10 individuals have succumbed to the disease. The map below will continue to be updated as we gather and uncover additional information.
The most recent information about the virus is presented on the GIS map above for Georgia. The JHU map is also embedded and linked within this post. To read a more in-depth explanation about the JHU map, click here or keep scrolling beyond the map.
For an updated view of graphs and data related to the infection and fatality rate of the virus, visit COVID Math.
Georgia STEM recommends that you continue to educate yourself as the virus information is released from reliable medical and health sources. You can also follow Georgia STEM on social media. We will only post updates and information from confirmed and reliable medical and health sources. Be careful of sensational and inaccurate posts. Follow us on Facebook, Twitter and Instagram.
For a list of Common Misconceptions about the Coronavirus and how to combat them with facts, check out the blog post here.
If you prefer, here is the mobile version of the GIS map.
All of the following information was retrieved from the sources cited. Georgia STEM does not claim ownership and is simply restating posted information and linking to the original article.
Timeline- From Johns Hopkins “Mapping 2019-nCoV”
December 2019
On December 31, 2019, the World Health Organization (WHO) was informed of an outbreak of “pneumonia of unknown cause” detected in Wuhan City, Hubei Province, China. Wuhan City is the seventh-largest city in China with 11 million residents.
As of January 23, there are over 800 cases of 2019-nCoV confirmed globally. These include cases in at least 20 regions in China and nine countries/territories. The first reported infected individuals showed symptoms as early as December 8. These patients were discovered to be among stallholders from the Wuhan South China Seafood Market. Subsequently, the wet market was closed on Jan 1.
January 2020
The virus causing the outbreak was quickly determined to be a novel coronavirus. On January 10, gene sequencing further determined it to be the new Wuhan coronavirus, namely 2019-nCoV. 2019-nCoV or COVID is a betacoronavirus, related to the Middle Eastern Respiratory Syndrome virus (MERS-CoV) and the Severe Acute Respiratory Syndrome virus (SARSCoV). However, the mortality and transmissibility of 2019-nCoV are still being determined. COVID fatality rate is likely to vary from those of the prior referenced coronaviruses (SARS 9.5% and MERS 34%).
Infected travelers (primarily air) are known to be responsible for introductions of the virus outside Wuhan. On Jan 13 Thailand reported the first international case outside China. The first cases within China, but outside of Wuhan were reported on January 19, in Guangdong and Beijing. On January 20, China’s National Health Commission (NHC) confirmed that the coronavirus can be transmitted between humans. On the same day human infections with 2019-nCoV had also been confirmed in Japan and South Korea, On January 21, cases in the U.S. and Taiwan were detected in travelers returning from Wuhan. On January 21 multiple provinces in China were also reporting new cases and infection was confirmed in 15 healthcare workers. Of these workers, six fatalities were reported. Additional travel cases have now been confirmed in Hong Kong, Macau, Singapore and Vietnam. On Jan 22, a WHO emergency committee convened to discuss whether the outbreak should be classified as a public health emergency of international concern (PHEIC). In order to make this determination, they followed the International Health Regulations. The team was undecided due to a lack of information and eventually came to a consensus against the declaration.
Of immediate concern is the risk of further transmission resulting from high travel volumes and mass gatherings in celebration of the Chinese New Year on January 24. In attempts to mitigate local transmission within China, unprecedented outbreak control strategies were implemented in (initially) three cities. On 23 January 2020, Wuhan suspended all public transport and air travel (in and out of the city). Wuhan also responded by placing all 11 million city residents under quarantine. On Jan 24, Huanggang and Ezhou, cities adjacent to Wuhan, will also be placed under a similar quarantine. Further, many cities have canceled Chinese New Year celebrations.
As Wuhan is a major air transportation hub in central China, various measures have been taken on a global scale to mitigate international spread. Targeted airport screening of passengers traveling from Wuhan was initiated as early as January 1 in Hong Kong and Macau. Taiwan, Singapore and Thailand starting to screen arriving passengers on January 3. In the U.S., the CDC began entry screening of passengers on direct and connecting flights from Wuhan to the three main ports of entry on January 17, 2020, with Atlanta and Chicago soon to be added. On January 23 the U.S. CDC raised its travel notice for Wuhan, China, to the highest of three levels. Additional Pacific and Asian countries including Malaysia, Sri Lanka, Bangladesh and India are now also conducting targeted passenger screening at airports.
GIS Dashboard Introduction
In response to this ongoing public health emergency, Johns Hopkins developed an interactive web-based dashboard , hosted by the Center for Systems Science and Engineering (CSSE) , to visualize and track reported cases in real-time. The dashboard illustrates the location and number of confirmed COVID-19 cases, deaths and recoveries for all affected countries. It was developed to provide researchers, public health authorities and the general public with a user-friendly tool to track the outbreak as it unfolds. Further, all the data collected and displayed is made freely available, initially as google sheets, now in a GitHub repository, along with the feature layers of the dashboard, which are now included in the ESRI Living Atlas.
The dashboard reports cases at the province level in China, city level in the US, Australia and Canada, and at the country level otherwise. From January 22-31 the entire data collection and processing was managed manually. During this period the number of updates were typically conducted twice a day, both morning and night (Eastern Time).
February 2020
As the outbreak evolved, the manual reporting process became unsustainable, and on February 1, JHU adopted a semi-automated living data stream strategy. Our primary data source is DXY, an online platform run by members of the Chinese medical community. DXY aggregates local media and government reports to provide COVID-19 cumulative case totals in near real-time at the province level in China and country-level otherwise. Every 15 minutes, the cumulative case counts are updated from DXY for all provinces in China and affected countries and regions.
To identify new cases, JHU monitors various twitter feeds, online news services, and direct communication sent through the dashboard. Before manually updating the dashboard, we confirm the case numbers using regional and local health departments, namely the China CDC (CCDC), Hong Kong Department of Health, Macau Government, Taiwan CDC, European CDC (ECDC), the World Health Organization (WHO), as well as city and state-level health authorities. For city-level case reports in the U.S., Australia, and Canada, which we began reporting on February 1, we rely on the US CDC, Government of Canada, Australia Government Department of Health and various state or territory health authorities. All manual updates (outside mainland China) are coordinated by a team at JHU.
The Math
The following are simple math calculations based on the numbers as of 7:00 pm on March 3, 2020. Georgia STEM are creating a separate post where we will update the math daily and post. You can find that daily update on the COVID-19 outbreak here
Current Fatality (Death) Rate = 3.4%
This number is calculated based on the number of deaths out of the total number of cases. For reference, the death rates of some other commonly known viruses are:
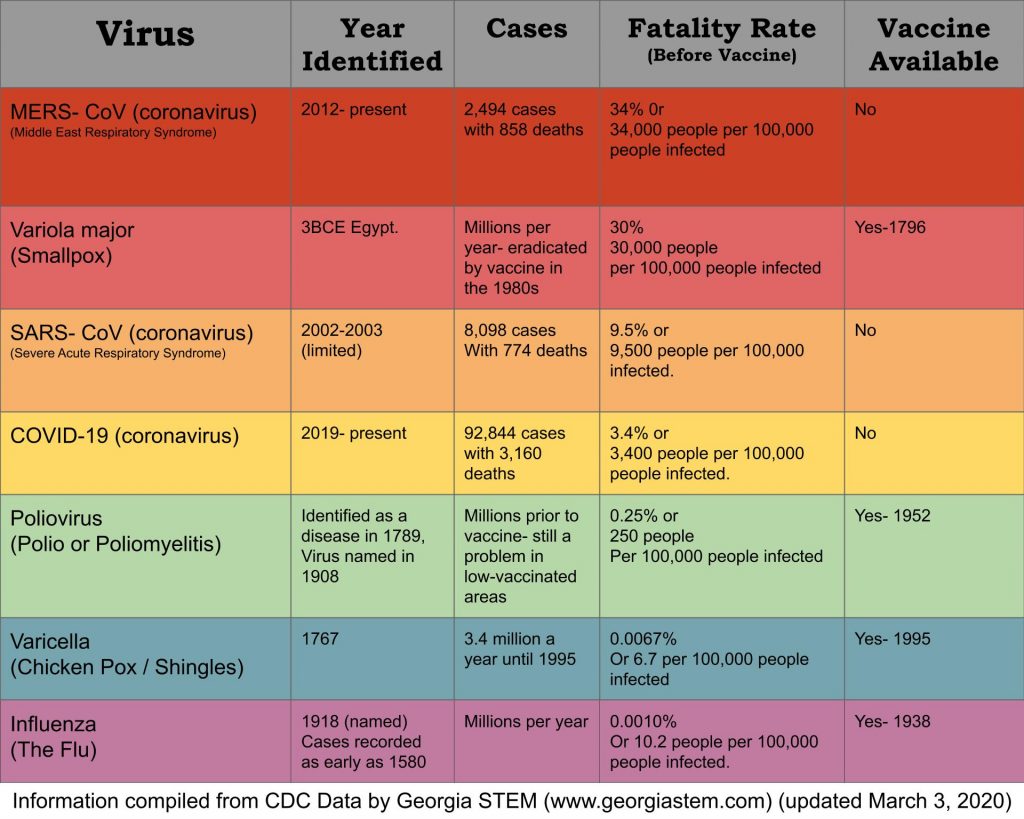
The most important point to note here is that the fatality rate may be higher with MERS but we have to look at the total number of cases. For whatever reason, the MERS coronavirus is not spreading as easily as the COVID-19 version. We have only had a little more than 2,400 cases in the last 7 years but COVID-19 already has almost 100,000 recorded cases. This number is probably a low estimate as well due to the limited number of test kits available.
At Georgia STEM, we think this is a great teaching opportunity to explain how GIS mapping is vital to tracking a virus and can also be used for other types of data, like storm tracking. For more information of GIS and how to teach it we recommend: GIS for Science Engagement.
Make sure you check out the current math updates and share the COVID-19 misconceptions and how to combat them.
Please post comments or questions below or reach out to Georgia STEM or Dr. Cassidy via social media.


How long will it take before a cure can be found?
The simple answer is that we don’t know. We can be reassured though that we have some amazing scientists and researchers working on the problem and trying to find ways to treat the symptoms, lessen the impact and work towards a solution. Until then, we just have to stay calm, practice common sense and try to limit the spread.
How many cases are being found on and average per hour?
That’s an excellent question. I think it varies but if I break it down mathematically- As of March 4, 2020 at 4:00pm, there are 95,113 confirmed cases since being identified and tracked from December 31, 2019. That is 64 days or 1,536 hours. So, that means there have been 95,113 infections in 1,536 hours which means approximately 62 people are being infected per hour.
Isn’t that the same as 1 per second??
It is actually the same as 1 per min. 62 people infected per hour / 60 min in an hour = about 1 person per minute. For more COVID math – go to http://www.georgiastem.com/covidmath
What is the most reliable way to keep from getting the Corona Virus?
The biggest thing we can do is to practice good hygiene and wash our hands. Viruses have to get into our bodies before they can make us sick. Our skin really protects us well. As long as the virus just gets on our skin, it is not usually going to make us sick. The problem is that we all tend to touch our faces 2,000 to 3,000 times a day. We also use our hands for eating and the virus can get introduced if we don’t wash our hands and contaminate the food we are eating. So just keep washing your hands and encourage others to wash their hands and don’t share items like forks and spoons, drinks, vaping devices, straws and toothbrushes. No need to panic but we should all be paying more attention to basic hygiene to help limit the spread.
how many days has the virus be harming people?
It’s hard to determine the index patient (the first person who got the virus) but we believe it to be a person who visited a wet market in Wuhan Province in China in Decemeber 2019. We have been tracking the virus (once we identified it) for a little over 2 months. It was first identified here in the United States on Jan. 21, 2020 and the first reported death was on March 1, 2020. To see more of the current infection and fatality rates, go to http://www.georgiastem.com/covidmath
Does this virus use asexual or sexual reproduction?
Ok so this can be complicated. Viruses don’t really reproduce so much as convince cells to make copies of them, which could be considered a form of asexual reproduction if you wanted to classify it that way. We typically talk about sexual and asexual reproduction with cells, not pseudo-living organisms, like viruses, viroids, bacteriophages or prions.
However, certain viruses can also perform what could be considered a form of sexual reproduction. If a single cell is infected with two similar but not identical COVID viruses, the new COVID viruses created in the cell could contain a mixed combination of genetic material from both parent viruses. That could be considered a form of sexual reproduction, and serves a similar role evolutionary by allowing beneficial mutations from two different lineages to mix. This is part of why we get new strains of the viruses, like the flu, every year.
We already know we have at least 2 strains of COVID so we are still investigating how it replicates itself and is evolving. Thank you for the great question.