
UPDATE- March 14, 2020, 1:00pm
Since the original publication of this article, we have received many questions- mostly on Facebook, about the source of data, how it matches with the CDC and WHO and state departments of health. We are continuing to update the numbers because this is a fluid situation. We are also working on a post about the Science and Technology needed for the test itself. The Georgia Department of Public Health announced that they only have the ability to run 50 tests a day with hopes to increase capacity to 100 by Monday. Why? We are delving into this to determine if it is an equipment issue, are there not enough machines, not enough people trained to run the test? What is going on? We will keep you updated as soon as we can.
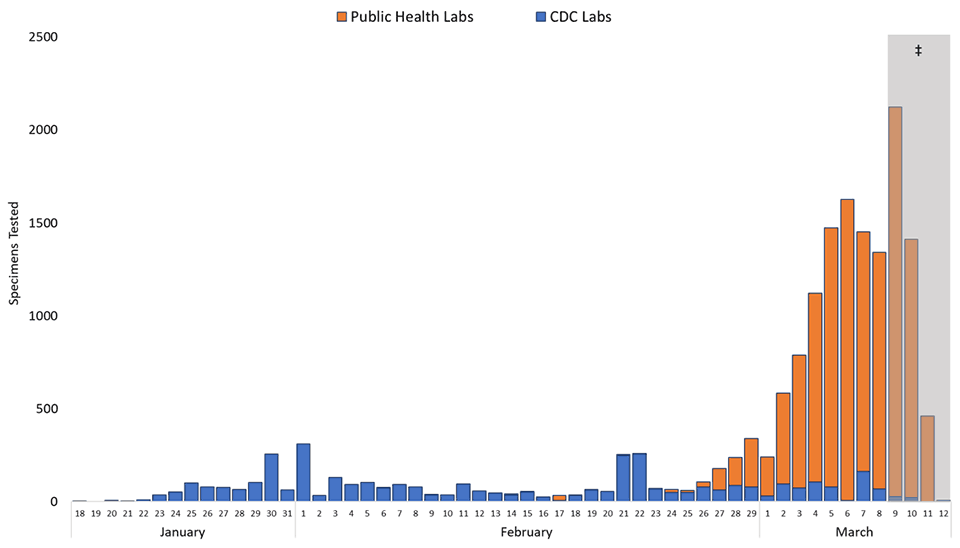
The main controversy in this post seems to be over this chart below posted on the CDC website regarding testing.

Here is what we think is confusing people. Our data below is reporting PEOPLE tested and the graph above is reporting SPECIMENS tested. a person will be tested 3 times. The first time is a test done at the medical facility or it could be outsourced to a public lab. Then the second test is done to confirm the first test. (if those 2 have conflicting results, a third test is done). After receiving 2 positive tests for COVID- the specimen is sent to the CDC. At the CDC it is tested again. Sometimes this is done multiple times, especially if there was inconsistencies in the previous testing. So- these numbers in the graph are reporting SPECIMENS, not PEOPLE. So let’s convert them numbers-
If we convert our numbers to the numbers of specimens tested- as of March 8, 2020 (last data reported on PEOPLE) there were 1707 people tested. Each of those were tested at least 3 times. We multiply 1707 by 3 to get a conservative measure of the number of specimens tested. This gives us: 5,121 tests run. We know this is low because some of the tests have expired before they were run because they can’t run them fast enough and the sample degrades. This leads to bad test results. So if there is an error of 25% on tests- we must add 25% to that number and we get 6,401 tests run.
The CDC is saying that they have run 3,958 tests at their lab. We don’t think that each of these specimens is a single person. We anticipate that before the outsourcing began to public labs, they were testing multiple times on the same person. Let’s just say they tested 25 % of the people twice (we know it is likely higher) that would mean that we could eliminate 25% of the tests as repeats. That would leave 2,968 possible PEOPLE who were tested at the CDC. The CDC also accepts tests internationally though so this number doesn’t help us much. Sigh.
Now let’s look at Public Labs. They have run 12,584 tests. If that is an average of 3 tests per person, that would be 4,194 PEOPLE tested. We do know that some public US labs are also taking specimens from Canada, Mexico and other countries who are paying them to run tests.
The short answer is, the data is terrible. So this is what we decided to do. We are running a range of numbers from a low of 2,968 people tested to a high of 4,500 people tested. We will retain the number confirmed at 2488 (gathered from ARCGIS from JHU at 1:19 pm on March 14, 2020)
Here is the subsequent math and graph. Whew.
Identification of individuals who have the virus is a vital part of the containment process. One of the major obstacles facing the US is the lack of test kits available to be utilized. According to data from the CDC on March 8, 2020, only 5 people out of every 1 million Americans were able to be tested. This number has since increased to between 12-14 people for every 1 million Americans.
The Georgia Department of Health announced they Only have resources to run 50 kits per day. Many people are confused about how a test can be so hard to do so we are working on a post to explain the test and the science behind the identification process.
Looking at the data below- you can see that the US has a big problem. We are not testing enough. The graph below compares the US to a random assortment of other countries that we just grabbed from the WHO and CDC report (we tried to grab an assortment but you can go look at all the data if you are so inclined)
To break it down for you and as the kids say “keep it real”. The US is only testing 12-14 out of every 1 million people. We have an average positive rate of 58.76%. To compare to other countries, this is odd. We are what Malcolm Gladwell would call an Outlier and it would not be a compliment. Several cases in Georgia were sent home from the Emergency Room (Polk and Charlton) because they did not qualify to be tested.
To see a larger image, click here
We CANNOT identify, contain and mitigate a Pandemic without testing. #TESTINGMATTERS You have probably heard on the news that South Korea has a very low fatality rate. Why? They are testing everyone! Look at the raw data below:
South Korea has tested 0.36% of its population, 189,236 people. They have identified 4.21 % that have the virus and only lost 0.83% to death. That is because they are catching it and getting them isolated and in treatment early.
The US has only tested around 0.0013% of our citizens. Of that 59 % of them have tested positive. Our guidelines for testing are too strict and the cost is too high out of pocket. Individuals are being asked to pay $300 upfront before they can request a test. We have lost 51 people to death and South Korea has only lost 72 and they have 8,086 cases and we only have 2488 (updated March 14, 2020 at 1:33 pm using data from JHU ARC GIS Map). Do you see the problem? Comment or ask questions below- This is SUPER Important! Share on social media and contact your congressman/congresswoman and senators. #FlattentheCurve #TestingMatters
Georgia STEM is committed to #FlattentheCurve and we know that #TESTINGMATTERS Please help us spread the word and learn more at https://t.co/Zcdfmd8xsZ #georgiastem #covid19 #covid19ga #covid_19 #coronavirus #STEMGeorgia
— GeorgiaSTEM.com (@Georgia_STEM) March 13, 2020
Another obstacle that has emerged in the past 24 hours is transparency in data reporting.
So as you all who have been following our COVID updates since back in Feb- you know we have been tracking and maintaining COVID Math data and also adding to a real-time update.
We started this 2 weeks before most of the major news outlets. We are a small non-profit with a very limited number of followers but we still think it is important to provide accurate data and be a source you can trust. Yesterday, we pulled the US data off the JHU map and added it to our database. The US had 1663 cases and we timestamped it at 12:03 am March 13, 2020. We also had 40 deaths. Since 8 am this morning, data has started to disappear from the map. Georgia data is completely missing, for example. Now the US numbers say there are only 1268 cases and 33 deaths.
Georgia has stopped reporting county-level data as well now. They will only provide a range of cases for each county. They are also not reporting how many they are testing and presumptive cases are no longer available as a data point. We have also lost the data related to recovery and deaths. We assume deaths will be reported but they are no longer in the raw data.
What are your thoughts? Please- we are sincerely interested. Comment below and if you feel led- please share on social media so we can get a consensus. Are we overreacting because we love data or is this a problem?
You can also comment on our COVID-19 update post or the COVID math post or even on the map- Check out the links below:

ok so you say that the number tested is 1707 but on the CDC website it says over 3000. What is going on with that?
The quickest and simplest answer is that the data is terrible. There is a very good reason for this though. Most of the experts at the CDC are so busy trying to keep up with the testing and other essential tasks that the data sometimes takes lower priority. We saw this with SARS too. When SARS was ongoing in 2002-2003 the fatality rate was reported at 3-4% but after it was all over- they were able to finally crunch all the data and it was 9.6% We are unable to employ the staff levels needed for a Pandemic for normal operations. When something like this hits, there is simply not enough people with clearance levels high enough. We are doing our best and they are doing their best. We did update the Testing Matters post today and we pleased that the numbers are looking better.